Boost your results! Visualize your campaign performance from three angles:
-
Global: An overview of all your campaigns
-
Individual: Detailed insights for each campaign
-
Ad level: The effectiveness of each creative
Campaign performance
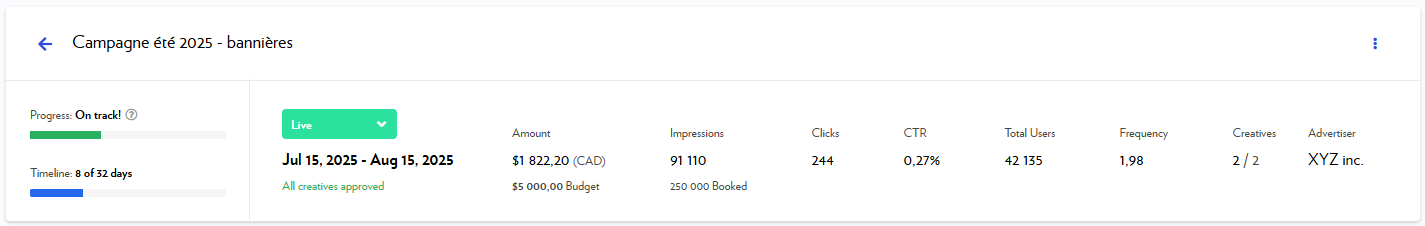
Key data at a glance
When you open a campaign, essential performance statistics appear at the top of your screen. This makes it easy to track results, allowing you to adjust your campaigns as needed. This data updates continuously.
|
Data |
Explanation |
Updates |
|
Amount |
Total spent |
Hourly |
|
Impressions |
Number of times the ad was shown |
Hourly |
|
Clicks |
Number of times users clicked the ad |
Hourly |
|
CTR (Click-Through Rate) |
Percentage of users who clicked on the ad among those who saw it. Calculated as: Clicks/Impressions |
Hourly |
|
Total Users |
Number of unique users who saw the ad during the campaign |
Daily |
|
Frequency |
Average number of times a single user was exposed to the ad |
Daily |
Visualizing performance with graphs
For easier analysis, your results are also presented visually in graphs.
-
For an overview of all your campaigns:
Check the Performance Summary in your dashboard's Campaigns section, located below your campaign list. -
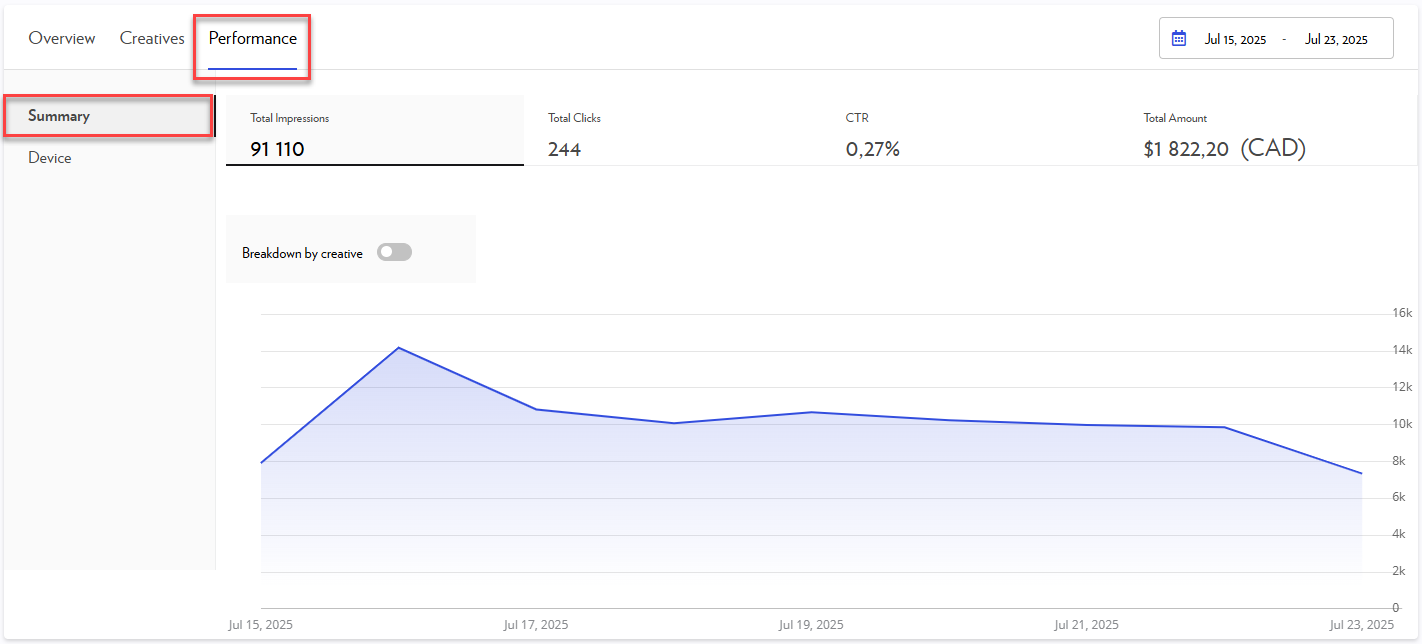
For a detailed look at a single campaign:
Navigate to the Performance tab of the specific campaign.
The graphs in both locations are similar.
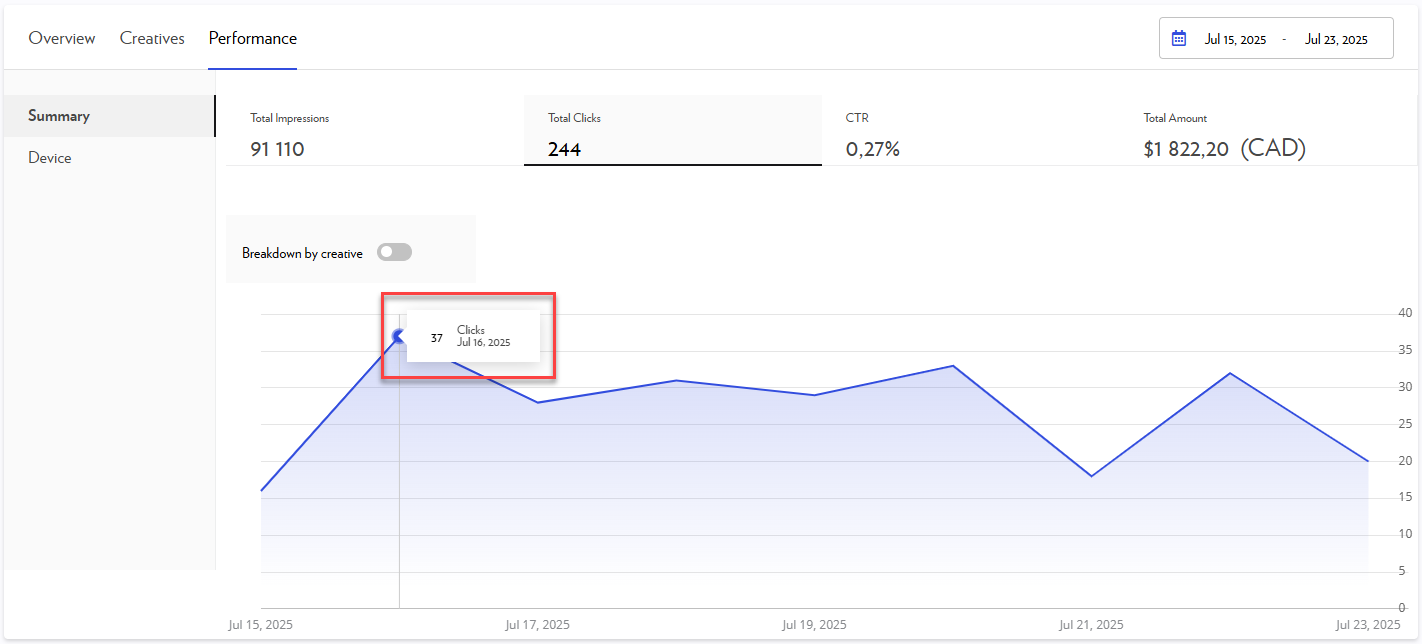
In the Summary section, switch between four tabs to view:
-
Impressions delivered
-
Clicks
-
Click-through rate (CTR)
-
Total amount spent
In the Device section, you will find:
-
Impressions delivered per device type
-
Corresponding percentages
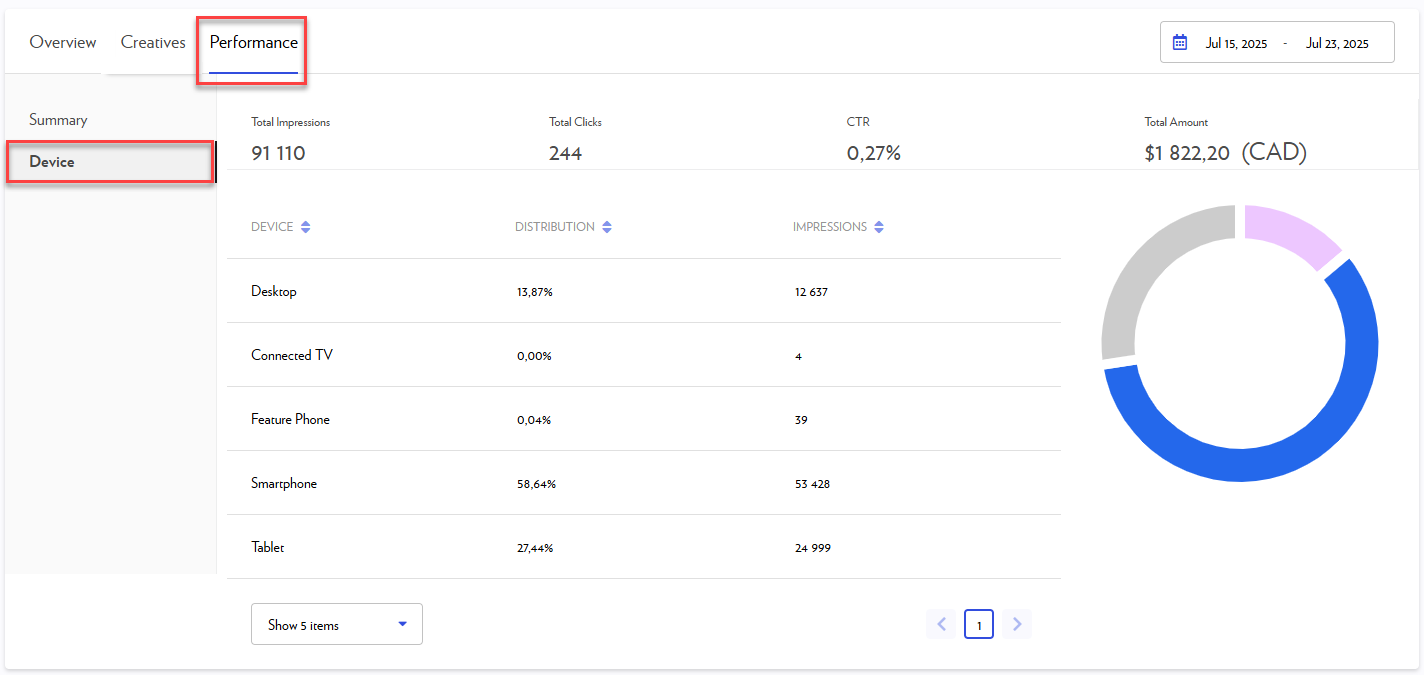
The device breakdown shows the actual device our readers use (computer, tablet, phone, TV, etc.), not a split between our different editions (lapresse.ca, La Presse+, La Presse Mobile). This distinction is crucial as our website is accessible on various devices.
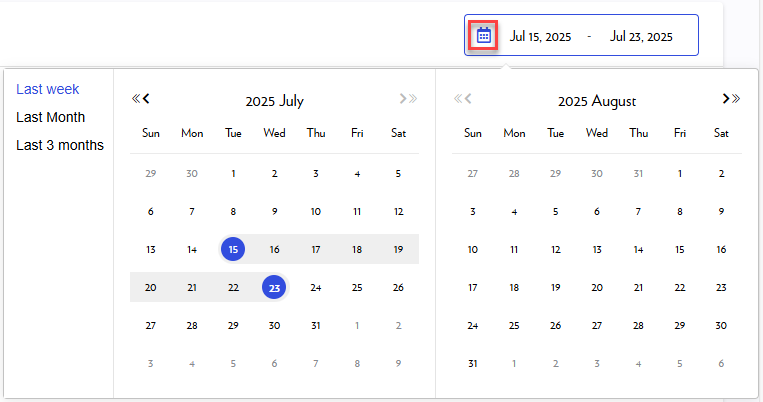
To see data for a specific timeframe, simply filter the graphs by period using the calendar icon.
Hover over any graph line to see daily results.
Ad statistics
Within each campaign, data for individual ads is available in two places:
-
The Creatives tab
-
The Performance tab
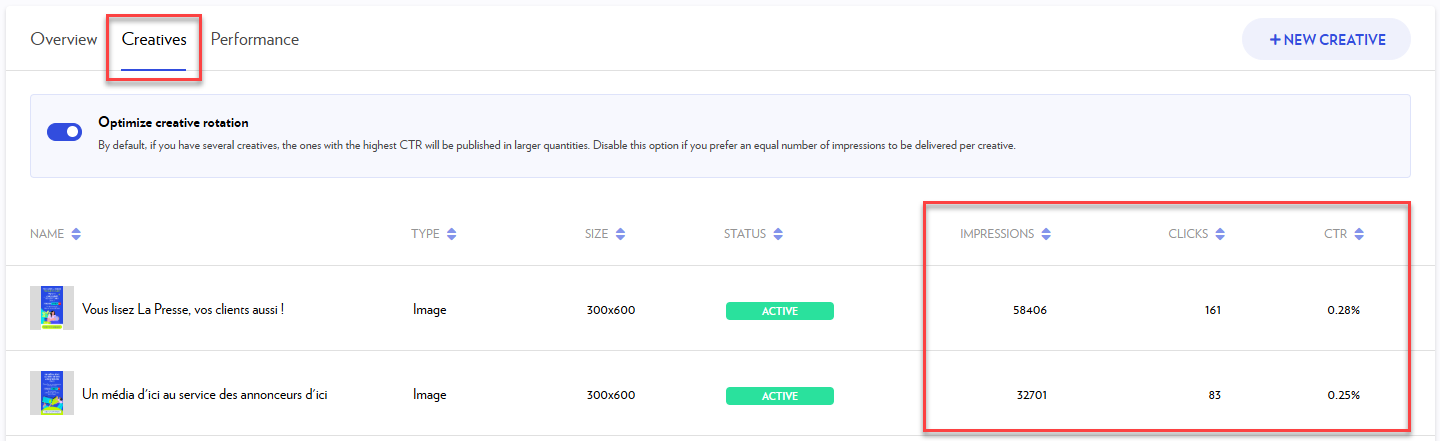
Creatives tab
This tab displays statistics per creative. Use this to quickly identify your most effective ads.
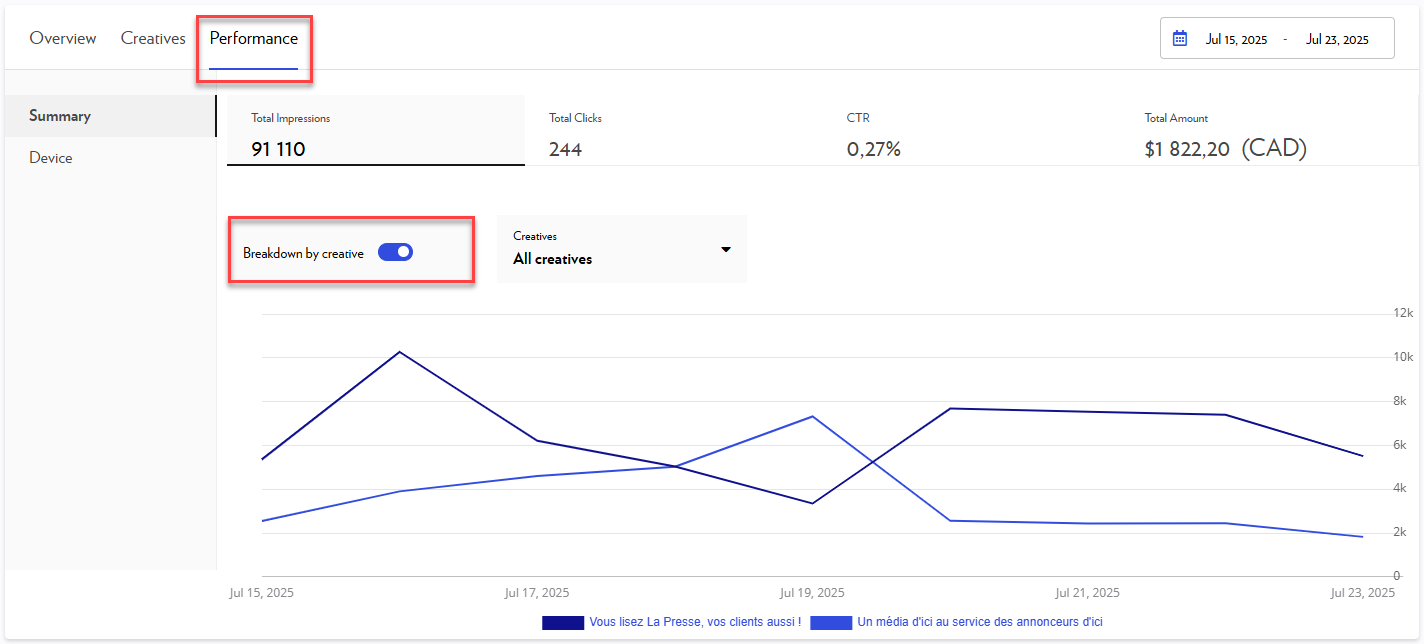
Performance tab
In the Summary section of the Performance tab, enable Breakdown by creative to view each ad's statistics graphically. Hover over the graph line for daily results.
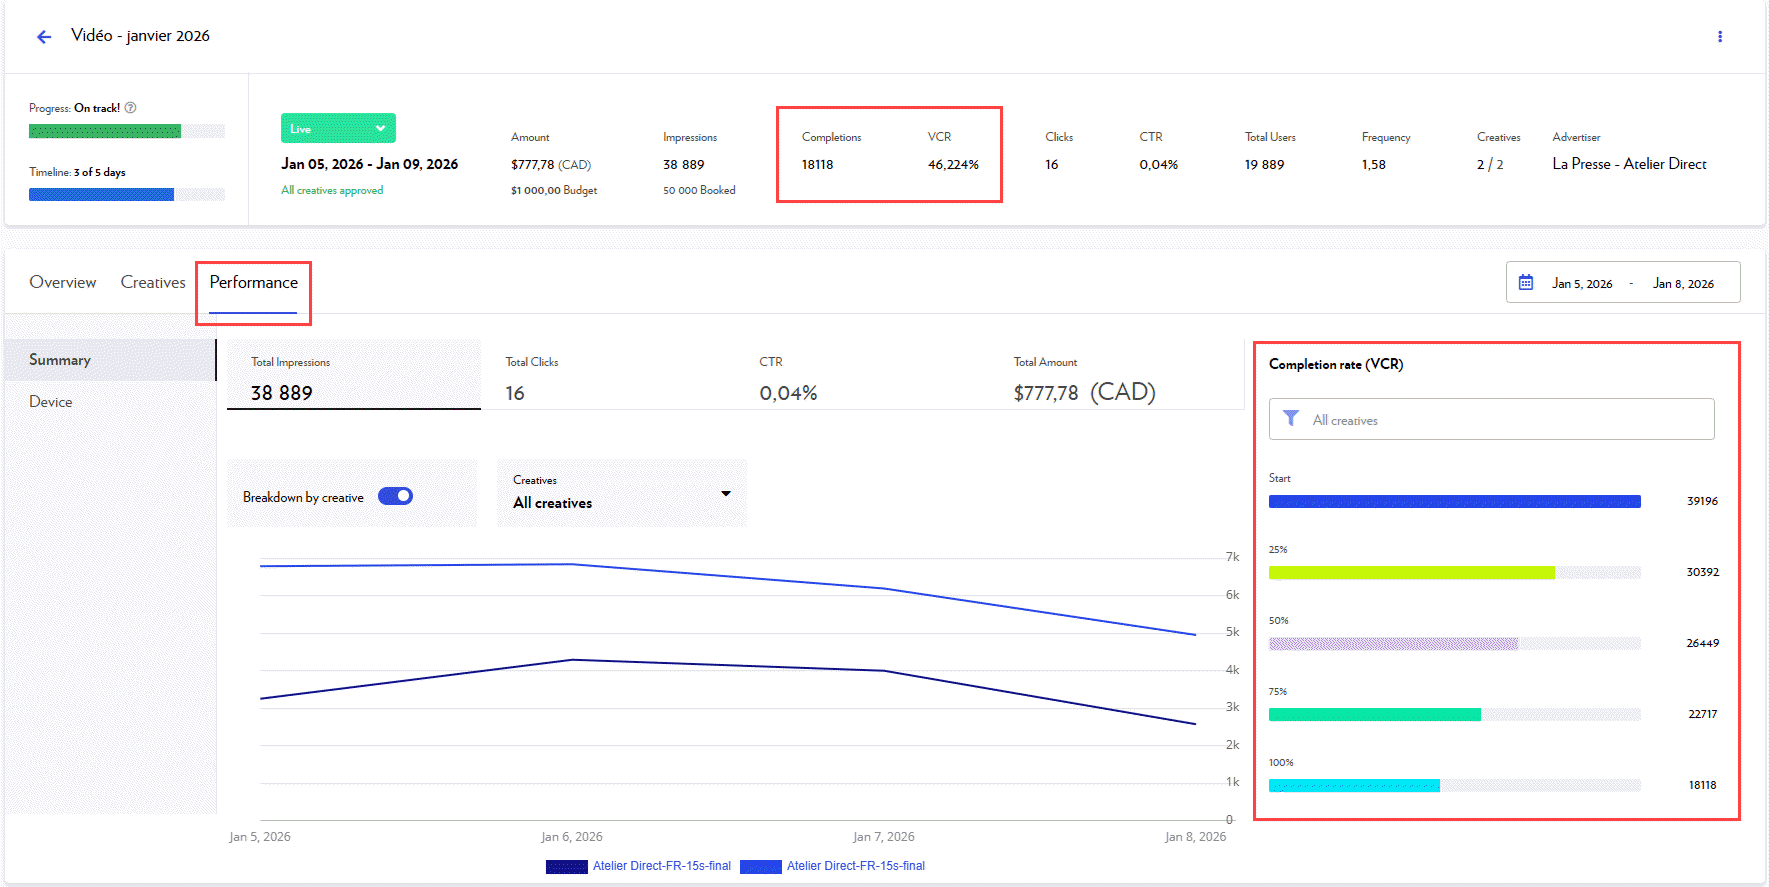
Detailed video statistics
Additional data for videos is available in the campaign's Performance tab.
|
Data |
Explanation |
Updates |
|
Completions |
Number of viewers who watched the video to the end |
Hourly |
|
Completion rate (VCR) |
Percentage of viewers who watched the entire video. Calculated as: (Number of 100% video views / Number of video starts) x 100 |
Hourly |
|
Start |
Number of times the video started playing |
Hourly |
|
25% |
Number of viewers who watched the first quarter of the video |
Hourly |
|
50% |
Number of viewers who watched half of the video |
Hourly |
|
75% |
Number of viewers who watched three-quarters of the video |
Hourly |
|
100% |
Number of viewers who watched the video to the end |
Hourly |
Common questions
Can I view performance by geographical area or by interest?
Our ad serving delivery does not allow for performance data to be segmented by geographical area or interest within a single campaign. Your campaign is delivered globally based on the parameters defined during its creation.
To obtain detailed statistics for these criteria, we recommend creating separate campaigns for each segment. This is the only way to accurately isolate and compare the performance of each area or interest.
Why doesn't the product of "Total Users" and "Frequency" exactly match the number of "Impressions"?
This discrepancy is normal and can be attributed to two main factors:
-
Frequency is a rounded average: The frequency shown in your reports (e.g., 1.25) is a global average rounded for readability. In the backend calculation, this data contains many more decimal places, which leads to slight differences when performing a manual calculation.
-
Differences between individuals and events: "Total Users" (or Reach) is an estimate of the number of unique individuals who saw the advertisement, based on unique identifiers. Conversely, "Impressions" are an automatic and exact count of every single time the advertisement was displayed on a screen.
Note: It is common to observe a slight variation (higher or lower) without it affecting the overall reliability of your performance data.